[R] 4. feasts
반응형
feasts
feasts의 의미는 Feature Extraction And Statistics for Time Series의 약자라고 합니다. (FEASTS)- 시계열 데이터 분석에 필요한 여러 가지 함수들을 제공하는 라이브러리 입니다.
- 시계열 분해, 추출, 시각화 등
Graphics: gg_season(), gg_subseries(), gg_lag(), ACF()
- 시계열 데이터의 패턴을 이해하기 위해 첫 단계로 시각화로 접근을 합니다.
- 먼저
gg_season()함수를 사용하여 계절성(seasonality)을 확인해볼 수 있습니다. - 예시로
tsibbledata라이브러리 내aus_production데이터를 사용하겠습니다.- 해당 데이터는 호주의 맥주, 담배 등 여러 품목별 생산지표 추정치에 관한 데이터입니다.
aus_production %>%
  gg_season(Beer)
gg_subseries()함수를 사용하면 시계열의 각 season별로 시각화를 보일 수 있습니다.
aus_production %>%
  gg_subseries(Beer)
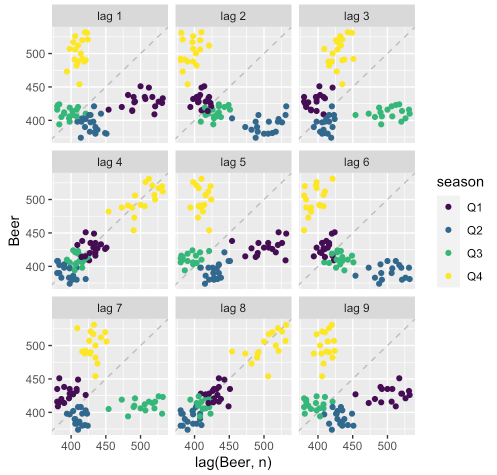
gg_lag()를 이용하면 원 데이터와 그 시점의 시차(lag)에 대한 산점도를 season별로 시각화할 수 있습니다.
aus_production %>%
  filter(year(Quarter) > 1991) %>%
  gg_lag(Beer, geom = "point")
- 분기 단위의 데이터이기에 lag 4와 lag 8을 보면 각 season별로 원 데이터(x축)와 lag(y축)간의 선형관계가 잘 놓여져있는 것을 확인할 수 있습니다.
- ACF(자기상관함수, Auto Correlation Function)도
ACF()함수와autoplot()함수를 사용하여 그릴 수 있습니다.- 자기 상관 함수란 {i} 시점과 {i+k} 시점간에 상관계수 값이라고 이해하시면 됩니다.
aus_production %>%
  ACF()
## Response variable not specified, automatically selected `var = Beer`## # A tsibble: 23 x 2 [1Q]
## lag acf
## <lag> <dbl>
## 1 1Q 0.684
## 2 2Q 0.500
## 3 3Q 0.667
## 4 4Q 0.940
## 5 5Q 0.644
## 6 6Q 0.458
## 7 7Q 0.621
## 8 8Q 0.887
## 9 9Q 0.598
## 10 10Q 0.410
## # … with 13 more rowsaus_production %>%
ACF() %>%
autoplot()## Response variable not specified, automatically selected `var = Beer`
Decompositions
- 시계열 분해(decomposition)는 시계열 데이터 분석에서 흔히 수행되는 작업 중 하나 입니다.
- 시계열에 대한 패턴을 이해하는데 도움을 주며, 추후 예측 모델링 적용 시 정교성에 도움을 주기도 합니다.
- 즉, 시계열의 패턴을 조금 더 정교하게 하고 예측 성능을 향상시키기 위한 목적으로 필수적인 사전 전처리입니다.
Decompositions: Classical decomposition
- 접근 방식에 따라 크게 가법(additive), 승법(multiplicative) 두 가지로 분류됩니다.
- 보통 가법은 계절성이 추세에 따라 무관하게 일정한 크기나 수준을 유지하는 케이스일 때
- 승법은 계절성의 크기가 추세의 크기에 따라 변화하는 케이스일 때
- 원리에 대해서 해당 포스팅에서는 간단하게만 설명하겠습니다.
- 1단계: 최소제곱법으로 추세선(trend)을 적합하여 추정하고 이를 원래 데이터에서 뺴줌으로써 추세가 조정된 시계열을 만들 수 있습니다.
- 2단계: 1단계에서 구한 조정된 추세선을 가지고 계절성의 길이만큼 이동평균을 구하여 계절성을 제거합니다.
- 3단계: 2단계에서 계절성을 정리한 시계열을 가지고 다시 이동평균을 나누어 줌으로써 일차적으로 계절성을 추정합니다.
- 4단계: 3단계에서 구한 계절성들의 각 계절별 평균을 구하고 이 계절들 평균들의 합이 계절성의 길이가 되도록 조정한 지수를 만듭니다. 이 지수가 계절지수가 됩니다.
- 위 원리는 승법 분해에 대해서 정리한것인데 가법모형은 위 과정 3단계에서 비율을 이용해 나누어주는 것이 아닌 뺄셈을 통해 진행합니다.
- 위 예시 데이터를 가지고 가법 분해를 적용하는 사례입니다.
classical_decomposition()함수 내type = "additive"옵션을 적용하여 분해해볼 수 있습니다.
dcmp <- aus_production %>%
model(classical_decomposition(Beer, type = "additive"))- 분해된 시계열 요소들은
components()함수로 불러올 수 있습니다.
dcmp %>%
  components()
## # A dable: 218 x 7 [1Q]
## # Key: .model [1]
## # : Beer = trend + seasonal + random
## .model Quarter Beer trend seasonal random season_adjust
## <chr> <qtr> <dbl> <dbl> <dbl> <dbl> <dbl>
## 1 "classical_decomposition(… 1956 Q1 284 NA 2.13 NA 282.
## 2 "classical_decomposition(… 1956 Q2 213 NA -42.5 NA 256.
## 3 "classical_decomposition(… 1956 Q3 227 255. -28.5 0.256 256.
## 4 "classical_decomposition(… 1956 Q4 308 254. 68.9 -15.3 239.
## 5 "classical_decomposition(… 1957 Q1 262 257. 2.13 2.49 260.
## 6 "classical_decomposition(… 1957 Q2 228 260 -42.5 10.5 271.
## 7 "classical_decomposition(… 1957 Q3 236 263. -28.5 1.76 265.
## 8 "classical_decomposition(… 1957 Q4 320 265. 68.9 -13.5 251.
## 9 "classical_decomposition(… 1958 Q1 272 265. 2.13 4.49 270.
## 10 "classical_decomposition(… 1958 Q2 233 265. -42.5 10.9 276.
## # … with 208 more rows- 그리고 이 분해된 요소들을
autoplot()함수에 적용하면 아래와 같은 시각화를 볼 수 있습니다.
dcmp %>%
  components() %>%
  autoplot() %>%
  labs(title = "Classical additive decomposition of Quaterly production of Beer in Australia")
- 마찬가지로 승법 분해는
classical_decomposition()함수 내type = "multiplicative"옵션을 적용할 수 있습니다.
Decompositions: STL decomposition
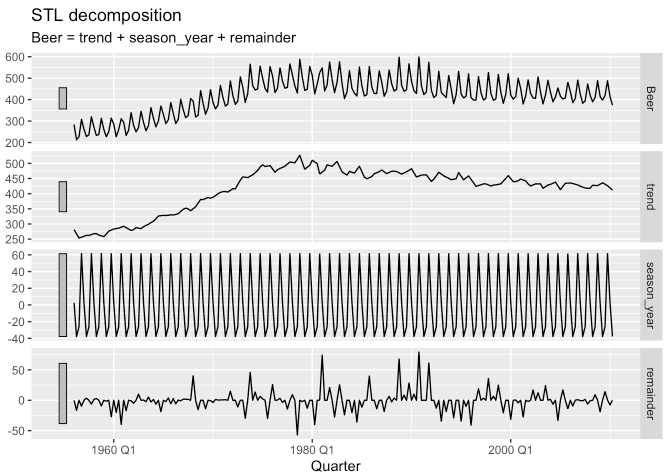
- STL은 Seasonal and Trend decomposition using Loess의 줄임말로 robust한 시계열 분해 방법에 해당됩니다.
- 여기서 loess란 Local regression, 우리가 흔히 알고 있는 선형회귀말고 비선형회귀에 해당합니다.
- 계절성(S) + 추세성(T) + Remainder component 로 분해
- 계절성에 대해 다른 분해 방법보다 조금 더 자유도가 높은 편이며, 시간에 따라 변화하는 계절성의 변화율을 분석가가 직접 조절할 수 있다는 장점이 있습니다.
- STL 분해에 대해 조금 더 자세히 알고 싶다면 여기를 참고하는 것도 좋을 것 같습니다!
- 아래 예시를 들어 설명하겠습니다.
aus_production %>%
  model(STL(formula = Beer ~ trend(window = 4) + season(window = "periodic"), robust = TRUE)) %>%
  components() %>%
  autoplot()
- 위 코드에서 보셨듯, 시계열의 추세 요소는
window옵션을 주어 flexible하게 추정할 수 있고
계절성은window = "periodic"으로 하여 고정시켰습니다. - 더 자세한 옵션은
?STL로 확인하시면 됩니다!
Feature extraction and statistics
features()함수를 통해 여러 가지 통계량이나 ACF 등을 추출할 수 있습니다.- 예시 데이터는
tourism데이터를 활용하겠습니다.- 해당 데이터는 분기별 호주 애형객 수에 관한 자료입니다.
- 먼저 단순히 평균, 분위수 값을 뽑는 방법은 아래와 같습니다.
#features() 함수에 대상 변수와 해당 통계량 함수들을 적용하시면 됩니다.
tourism %>%
  features(
    .var = Trips,
    features = list(avg = mean, quantile)
  )
## # A tibble: 304 x 9
## Region State Purpose avg `0%` `25%` `50%` `75%` `100%`
## <chr> <chr> <chr> <dbl> <dbl> <dbl> <dbl> <dbl> <dbl>
## 1 Adelaide South Austra… Busine… 156. 68.7 134. 153. 177. 242.
## 2 Adelaide South Austra… Holiday 157. 108. 135. 154. 172. 224.
## 3 Adelaide South Austra… Other 56.6 25.9 43.9 53.8 62.5 107.
## 4 Adelaide South Austra… Visiti… 205. 137. 179. 206. 229. 270.
## 5 Adelaide H… South Austra… Busine… 2.66 0 0 1.26 3.92 28.6
## 6 Adelaide H… South Austra… Holiday 10.5 0 5.77 8.52 14.1 35.8
## 7 Adelaide H… South Austra… Other 1.40 0 0 0.908 2.09 8.95
## 8 Adelaide H… South Austra… Visiti… 14.2 0.778 8.91 12.2 16.8 81.1
## 9 Alice Spri… Northern Ter… Busine… 14.6 1.01 9.13 13.3 18.5 34.1
## 10 Alice Spri… Northern Ter… Holiday 31.9 2.81 16.9 31.5 44.8 76.5
## # … with 294 more rows
- ACF에 관한 정보는
feat_acf()함수를 이용합니다. feat_acf()는 기본적으로 ACF와 관련된 값들을 제공합니다.acf1: 원래 시계열 데이터의 1차 자기상관계수acf10: 1~10차 자기상관계수 제곱합diff1_acf1: 1차 차분(lag) 시계열의 1차 자기상관계수diff1_acf10: 1차 차분 시계열의 1~10차 자기상관계수 제곱합diff2_acf1: 2차 차분 시계열의 1차 자기상관계수diff2_acf10: 2차 차분 시계열의 1~10차 자기상관계수 제곱합season_acf1: 첫 번째 계절 시차(seasonal lag)에서의 자기상관계수
tourism %>%
  features(
    .var = Trips,
    features = feat_acf
  )
## # A tibble: 304 x 10
## Region State Purpose acf1 acf10 diff1_acf1 diff1_acf10 diff2_acf1
## <chr> <chr> <chr> <dbl> <dbl> <dbl> <dbl> <dbl>
## 1 Adelaide South Aus… Busine… 0.0333 0.131 -0.520 0.463 -0.676
## 2 Adelaide South Aus… Holiday 0.0456 0.372 -0.343 0.614 -0.487
## 3 Adelaide South Aus… Other 0.517 1.15 -0.409 0.383 -0.675
## 4 Adelaide South Aus… Visiti… 0.0684 0.294 -0.394 0.452 -0.518
## 5 Adelaide… South Aus… Busine… 0.0709 0.134 -0.580 0.415 -0.750
## 6 Adelaide… South Aus… Holiday 0.131 0.313 -0.536 0.500 -0.716
## 7 Adelaide… South Aus… Other 0.261 0.330 -0.253 0.317 -0.457
## 8 Adelaide… South Aus… Visiti… 0.139 0.117 -0.472 0.239 -0.626
## 9 Alice Sp… Northern … Busine… 0.217 0.367 -0.500 0.381 -0.658
## 10 Alice Sp… Northern … Holiday -0.00660 2.11 -0.153 2.11 -0.274
## # … with 294 more rows, and 2 more variables: diff2_acf10 <dbl>,
## # season_acf1 <dbl>- 위 결과에서
season_acf1는 첫번째 계절 시차에서의 ACF를 나타내는데, 해당 데이터는 분기단위이기에 계절 주기는 4입니다. - 즉, 해당 값은 원계열 시차 4에서의 ACF값을 나타낸다고도 볼 수 있습니다.
feat_stl()함수를 사용하여 STL 분해 요소를 출력할 수도 있습니다.- 해당 함수는 추세와 계절성의 강도를 표현해주면서 아래 요소들도 같이 출력해줍니다.
seasonal_peak_year: 계절성이 가장 큰 시점 (분기 등)seasonal_trough_year: 계절성이 가장 작은 시점spikiness: Remainder component의 분산. 그냥 쉽게 말하자면 오차항의 분산 정도라고 생각하면 됩니다.linearity: STL 분해의 추세(trend) 성분의 선형성curvature: STL 분해의 추세 성분의 곡률(curvature)stl_e_acf1: 계절성과 추세성분을 제외한 나머지 계열들의 1차 자기상관계수stl_e_acf10: 계절성과 추세성분을 제외한 나머지 계열들의 1~10차 자기상관계수 제곱합
tourism %>%
  features(
    .var = Trips,
    features = feat_stl
  )
## # A tibble: 304 x 12
## Region State Purpose trend_strength seasonal_strengt… seasonal_peak_y…
## <chr> <chr> <chr> <dbl> <dbl> <dbl>
## 1 Adelaide South Au… Busine… 0.464 0.407 3
## 2 Adelaide South Au… Holiday 0.554 0.619 1
## 3 Adelaide South Au… Other 0.746 0.202 2
## 4 Adelaide South Au… Visiti… 0.435 0.452 1
## 5 Adelaide… South Au… Busine… 0.464 0.179 3
## 6 Adelaide… South Au… Holiday 0.528 0.296 2
## 7 Adelaide… South Au… Other 0.593 0.404 2
## 8 Adelaide… South Au… Visiti… 0.488 0.254 0
## 9 Alice Sp… Northern… Busine… 0.534 0.251 0
## 10 Alice Sp… Northern… Holiday 0.381 0.832 3
## # … with 294 more rows, and 6 more variables: seasonal_trough_year <dbl>,
## # spikiness <dbl>, linearity <dbl>, curvature <dbl>, stl_e_acf1 <dbl>,
## # stl_e_acf10 <dbl>- 해당 결과를 아래와 같이 시각화하여 어떤 유형이 가장 트렌드(x축)하고 계절적(y축)인지도 확인해볼 수 있습니다.
tourism %>%
  features(.var = Trips, features = feat_stl) %>%
  ggplot(aes(x = trend_strength, y = seasonal_strength_year, color = Purpose)) +
  geom_point() +
  facet_wrap(~ State)
- 휴가 등을 목적으로 하는 관광은 가장 계절적 패턴을 보입니다.
- 경향성은 Western Australia에서 가장 강하게 나타납니다.
tourism %>%
  features(.var = Trips, features = feat_stl) %>%
  filter(seasonal_strength_year == max(seasonal_strength_year)) %>%
  select(Region, State, Purpose)
## # A tibble: 1 x 3
## Region State Purpose
## <chr> <chr> <chr>
## 1 Snowy Mountains New South Wales Holidaytourism %>%
features(.var = Trips, features = feat_stl) %>%
filter(seasonal_strength_year == max(seasonal_strength_year)) %>%
select(Region, State, Purpose) %>%
left_join(tourism, by = c("Region", "State", "Purpose")) %>%
ggplot(aes(x = Quarter, y = Trips)) +
geom_line(size = 0.7) 
반응형
'time-series (tidy approach)' 카테고리의 다른 글
| [R] 6. Exponential smoothing (0) | 2021.07.29 |
|---|---|
| [R] 5. Time-series Regression (0) | 2021.07.29 |
| [R] 3. tsibbledata (0) | 2021.07.28 |
| [R] 2. tsibble (0) | 2021.07.27 |
| [R] 1. fpp3 간단한 소개 (0) | 2021.07.27 |
TAGS.

