[R] 5. Time-series Regression
library(fpp3)
#library(fable)
The linear model
\[y_{t} = \beta_0 + \beta_1 x_{t} + \epsilon_{t}\]
- 우리가 흔히 알고 있는 단순선형회귀 모형입니다.
- 이는 시계열 데이터에 적용할때도 마찬가지로 오차항에 대한 가정을 합니다.
- iid(independent identically distributed)
- 이를
fable라이브러리 내 함수를 활용하여 살펴보겠습니다.
- 예시 데이터는
us_change로tsibbledata라이브러리 내에 있습니다.- 1970년 1분기부터 2019년 2분기까지 미국의 개인 소비 지출(personal consumption expenditure)과 개인 소득(personal disposable income)의 분기별 변화(성장률) 시계열 데이터입니다.
us_change## # A tsibble: 198 x 6 [1Q]
## Quarter Consumption Income Production Savings Unemployment
## <qtr> <dbl> <dbl> <dbl> <dbl> <dbl>
## 1 1970 Q1 0.619 1.04 -2.45 5.30 0.9
## 2 1970 Q2 0.452 1.23 -0.551 7.79 0.5
## 3 1970 Q3 0.873 1.59 -0.359 7.40 0.5
## 4 1970 Q4 -0.272 -0.240 -2.19 1.17 0.700
## 5 1971 Q1 1.90 1.98 1.91 3.54 -0.100
## 6 1971 Q2 0.915 1.45 0.902 5.87 -0.100
## 7 1971 Q3 0.794 0.521 0.308 -0.406 0.100
## 8 1971 Q4 1.65 1.16 2.29 -1.49 0
## 9 1972 Q1 1.31 0.457 4.15 -4.29 -0.200
## 10 1972 Q2 1.89 1.03 1.89 -4.69 -0.100
## # … with 188 more rows- 각 변수별 분기 단위의 추이를 살펴보기 위해
tidyr::pivot_longer()함수를 사용하여 적절히 가공한 후 시각화해보겠습니다.
us_change %>%
  pivot_longer(
    cols = c("Consumption", "Income"),
    names_to = "Series",
    values_to = "value"
  ) %>%
  autoplot(value) +
  labs(y = "% change")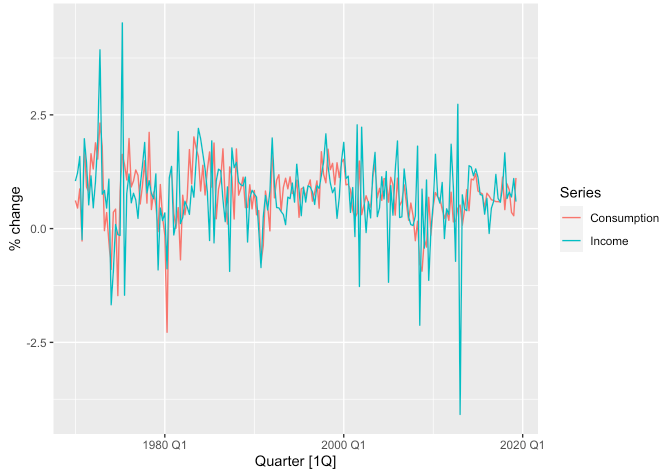
- 소득과 지출간의 선형관계를 살펴보겠습니다. (
geom_smooth(method = "lm")활용)
us_change %>%
  ggplot(aes(x = Income, y = Consumption)) +
  geom_point(size = 1.2) +
  geom_smooth(formula = y ~ x, method = "lm", se = FALSE) + # method = "lm"은 linear regerssion을 의미합니다.
  labs(
    x = "Income (quarterly % change)",
    y = "Consumption (quaterly % change)"
  )
- 같은 방식을
TSLM()함수를 사용하여 추정해보겠습니다. - 결과물 출력은
report()함수를 활용합니다.
us_change %>%
  model(TSLM(Consumption ~ Income)) %>%
  report()
## Series: Consumption
## Model: TSLM
##
## Residuals:
## Min 1Q Median 3Q Max
## -2.58236 -0.27777 0.01862 0.32330 1.42229
##
## Coefficients:
## Estimate Std. Error t value Pr(>|t|)
## (Intercept) 0.54454 0.05403 10.079 < 2e-16 ***
## Income 0.27183 0.04673 5.817 2.4e-08 ***
## ---
## Signif. codes: 0 '***' 0.001 '**' 0.01 '*' 0.05 '.' 0.1 ' ' 1
##
## Residual standard error: 0.5905 on 196 degrees of freedom
## Multiple R-squared: 0.1472, Adjusted R-squared: 0.1429
## F-statistic: 33.84 on 1 and 196 DF, p-value: 2.4022e-08- 그 결과 \(\text{Consumption} = 0.54454 + 0.27183\times\text{Income}\) 선형식이 도출되었습니다.
- 변수의 p-value 값은 유의미하며, 해석을 하자면 소득이 한 단위 증가할 때 지출은 평균적으로 0.27 단위가 증가한다고 볼 수 있습니다.
(절편까지 고려한다면 소득의 1%p 증가는 평균적으로 지출 0.27+0.54 = 0.82%p 증가로 이어짐)
Multiple linear model
\[y_{t} = \beta_0 + \beta_1 x_{1, t} + \beta_2 x_{2, t} + ... + \beta_k x_{k, t} + \epsilon_{t}\]
- 독립변수가 두 개 이상인 선형 회귀 모형입니다.
- 바로 예시로 적용해보겠습니다. 소비 지출을 예측하는 데 있어서 개인 소득뿐만 아니라 산업 생산과 개인 저축, 실업률을 포함하여 보고자합니다.
us_change %>%
  pivot_longer(
    cols = c("Production", "Savings", "Unemployment"),
    names_to = "Series",
    values_to = "value"
  ) %>%
  autoplot(value, show.legend = FALSE) +
  labs(y = "% change") +
  facet_wrap(. ~ Series, scales = "free_y", nrow = 3)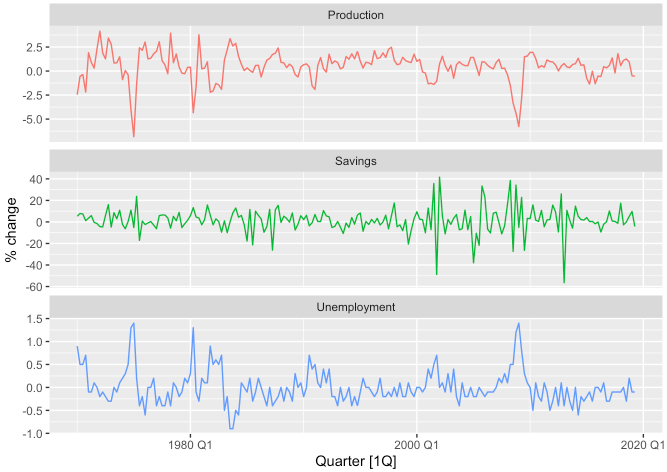
- 먼저 각 변수들간의 상관관계를 확인하고 싶습니다.
GGally라이브러리의ggpairs()함수를 사용하여 확인할 수 있습니다.
library(GGally)## Registered S3 method overwritten by 'GGally':
## method from
## +.gg ggplot2us_change %>%
ggpairs(columns = 2:6)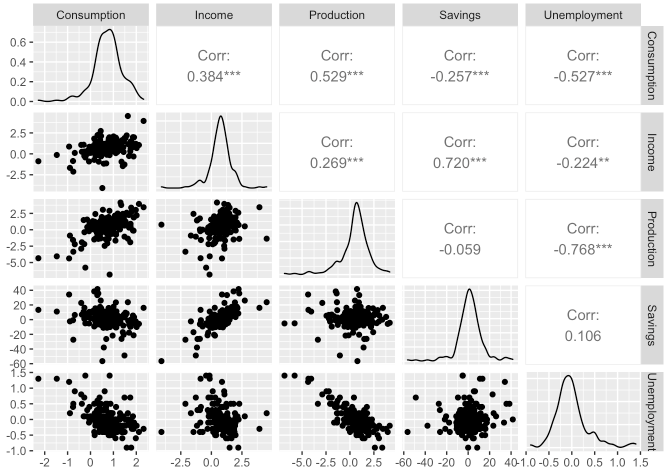
Least Squares Estimation
- 선형 회귀에서 각 회귀계수 \(\beta_{k}\)의 추정은 아래 오차항의 제곱합을 최소화하는 과정에서 얻어집니다.
\[\sum^{T}_{t=1}\epsilon_{t}^{2} = \sum^{T}_{t=1}\bigg(y_{t} - \beta_0 - \beta_1x_{1,t}-...-\beta_{k}x_{k, t} \bigg)^{2}\]
- 이 과정을 최소제곱추정이라고 합니다.
TSLM()함수는 시계열 데이터를 선형회귀모형에 적합시켜줍니다.- 물론 가장 널리쓰이는
lm()함수와 유사하지만TSLM()은 시계열 처리를 위한 부가 기능이 더 있다고 보시면 될 것 같습니다. - 위 예시를 그대로 이어가겠습니다.
fit_consMR <- us_change %>%
  model(tslm = TSLM(formula = Consumption ~ Income + Production + Unemployment + Savings))
fit_consMR %>%
report()## Series: Consumption
## Model: TSLM
##
## Residuals:
## Min 1Q Median 3Q Max
## -0.90555 -0.15821 -0.03608 0.13618 1.15471
##
## Coefficients:
## Estimate Std. Error t value Pr(>|t|)
## (Intercept) 0.253105 0.034470 7.343 5.71e-12 ***
## Income 0.740583 0.040115 18.461 < 2e-16 ***
## Production 0.047173 0.023142 2.038 0.0429 *
## Unemployment -0.174685 0.095511 -1.829 0.0689 .
## Savings -0.052890 0.002924 -18.088 < 2e-16 ***
## ---
## Signif. codes: 0 '***' 0.001 '**' 0.01 '*' 0.05 '.' 0.1 ' ' 1
##
## Residual standard error: 0.3102 on 193 degrees of freedom
## Multiple R-squared: 0.7683, Adjusted R-squared: 0.7635
## F-statistic: 160 on 4 and 193 DF, p-value: < 2.22e-16- 계수에 대한 해석은 다들 아실것이라 생각하고 스킵하겠습니다.
Fitted values
augment()함수를 사용하여 적합된 값을 출력할 수 있습니다.
fit_consMR %>%
augment()## # A tsibble: 198 x 6 [1Q]
## # Key: .model [1]
## .model Quarter Consumption .fitted .resid .innov
## <chr> <qtr> <dbl> <dbl> <dbl> <dbl>
## 1 tslm 1970 Q1 0.619 0.474 0.145 0.145
## 2 tslm 1970 Q2 0.452 0.635 -0.183 -0.183
## 3 tslm 1970 Q3 0.873 0.931 -0.0583 -0.0583
## 4 tslm 1970 Q4 -0.272 -0.212 -0.0603 -0.0603
## 5 tslm 1971 Q1 1.90 1.64 0.264 0.264
## 6 tslm 1971 Q2 0.915 1.07 -0.158 -0.158
## 7 tslm 1971 Q3 0.794 0.658 0.137 0.137
## 8 tslm 1971 Q4 1.65 1.30 0.347 0.347
## 9 tslm 1972 Q1 1.31 1.05 0.262 0.262
## 10 tslm 1972 Q2 1.89 1.37 0.513 0.513
## # … with 188 more rowsfit_consMR %>%
augment() %>%
ggplot(aes(x = Quarter)) +
geom_line(aes(y = Consumption, colour = "Data")) +
geom_line(aes(y = .fitted, colour = "Fitted")) +
labs(y = NULL, title = "Percent change in US consumption expenditure") +
scale_colour_manual(values = c(Data = "black", Fitted = "#D55E00")) +
guides(colour = guide_legend(title = NULL))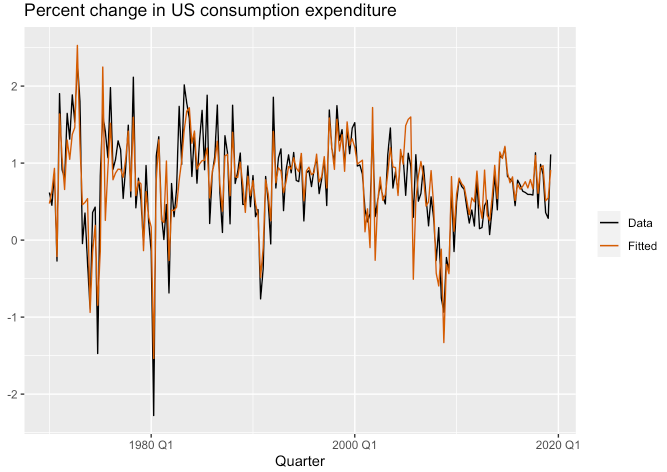
- 아래 그래프는 예상 소비 지출 대비 실제 소비 지출을 나타낸 산점도 입니다.
fit_consMR %>%
augment() %>%
ggplot(aes(x = Consumption, y = .fitted)) +
geom_point(size = 1.2) +
labs(
x = "Data (actual values)",
y = "Fitted (predicted values)",
title = "Percent change in US consumption expenditure"
) +
geom_abline(intercept = 0, slope = 1, color = "grey50")
Goodness-of-fit
- 선형 회귀 모형이 데이터에 얼마나 잘 맞는지 요약하는 일반적인 방법은 결정계수(coefficient of determination, \(R^{2}\)) 입니다.
- 이는 실제 값과 예측 값 사이의 상관관계 제곱으로 계산하거나 아래와 같이 계산할 수 있습니다.
\[R^{2} = \frac{\sum(\hat{y_{t}} - \bar{y})^2}{\sum(y_{t} - \bar{y})^2}\]
- 해당 값은 0과 1 사이에 위치하여 예측이 실제값과 가까울수록 1에 가까워지는 값을 가집니다.
- 이는
report()함수를 통해 결과물을 출력할 때Adjusted R-squared값으로 확인할 수 있습니다.
fit_consMR %>%
  report()
## Series: Consumption
## Model: TSLM
##
## Residuals:
## Min 1Q Median 3Q Max
## -0.90555 -0.15821 -0.03608 0.13618 1.15471
##
## Coefficients:
## Estimate Std. Error t value Pr(>|t|)
## (Intercept) 0.253105 0.034470 7.343 5.71e-12 ***
## Income 0.740583 0.040115 18.461 < 2e-16 ***
## Production 0.047173 0.023142 2.038 0.0429 *
## Unemployment -0.174685 0.095511 -1.829 0.0689 .
## Savings -0.052890 0.002924 -18.088 < 2e-16 ***
## ---
## Signif. codes: 0 '***' 0.001 '**' 0.01 '*' 0.05 '.' 0.1 ' ' 1
##
## Residual standard error: 0.3102 on 193 degrees of freedom
## Multiple R-squared: 0.7683, Adjusted R-squared: 0.7635
## F-statistic: 160 on 4 and 193 DF, p-value: < 2.22e-16
Standard error of the regression
- 모형이 데이터를 얼마나 잘 적합시켰는지에 대한 또 다른 평가는 잔차의 표준 오차로 알려진 잔차 표준 편차입니다.
\[\hat{\sigma_{e}} = \sqrt{\frac{1}{T-k-1}\sum^{T}_{t=1}e_{t}^2}\]
- 이 또한
report()함수를 통해 결과물을 출력할 때Residual standard error값으로 확인할 수 있습니다.
Evaluating the regression model
- 회귀 모형 적합 이후에는 모형의 가정이 충족되었는지 확인하기 위해 잔차항을 체크해야합니다.
ACF plot of residuals & Histogram of residuals
- 시계열 데이터의 경우 현재 t시점의 값이 이전 t-1 시점 또는 그 이전 기간의 값과 유사하거나 영향을 받을 가능성이 매우 높습니다.
- 따라서 시계열 데이터를 회귀 모형에 적합시킬 때는 잔차항에서 자기 상관을 찾는 것이 일반적입니다.
- 자기 상관이 있는 모델의 예측은 편향은 없기에 틀림이라고 볼 수는 없지만, 일반적으로 더 갭이 큰 예측 오차를 가질 가능성이 높습니다.
- 또한 잔차가 정규 분포를 따르는 지 확인해야 합니다.
gg_tsresiduals()함수를 통해 잔차항에 대한 진단을 해볼 수 있습니다.
fit_consMR %>%
gg_tsresiduals()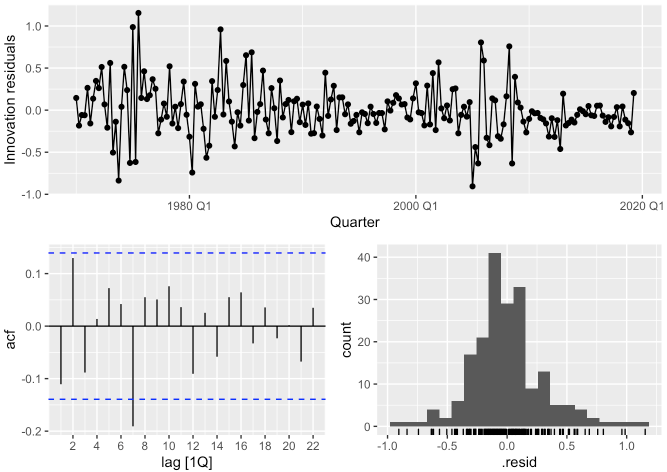
fit_consMR %>%
augment() %>%
features(
.var = .innov,
features = ljung_box,
lag = 10,
dof = 5
)## # A tibble: 1 x 3
## .model lb_stat lb_pvalue
## <chr> <dbl> <dbl>
## 1 tslm 18.9 0.00204- 자기상관함수 그래프에서 시차 7에 벗어나는 점을 보이지만 크게 영향을 미치지 않을 수도 있습니다.
Residual plots against predictors
- 각 변수에 대해 산점도를 체크해볼 필요도 있습니다.
fit_consMR %>%
  residuals()
## # A tsibble: 198 x 3 [1Q]
## # Key: .model [1]
## .model Quarter .resid
## <chr> <qtr> <dbl>
## 1 tslm 1970 Q1 0.145
## 2 tslm 1970 Q2 -0.183
## 3 tslm 1970 Q3 -0.0583
## 4 tslm 1970 Q4 -0.0603
## 5 tslm 1971 Q1 0.264
## 6 tslm 1971 Q2 -0.158
## 7 tslm 1971 Q3 0.137
## 8 tslm 1971 Q4 0.347
## 9 tslm 1972 Q1 0.262
## 10 tslm 1972 Q2 0.513
## # … with 188 more rowsus_change %>%
left_join(residuals(fit_consMR), by = "Quarter") %>%
pivot_longer(
cols = Income:Unemployment,
names_to = "regressor",
values_to = "x"
) %>%
ggplot(aes(x = x, y = .resid)) +
geom_point(size = 1.2) +
facet_wrap(. ~ regressor, scales = "free_x") +
labs(x = NULL, y = "Residuals")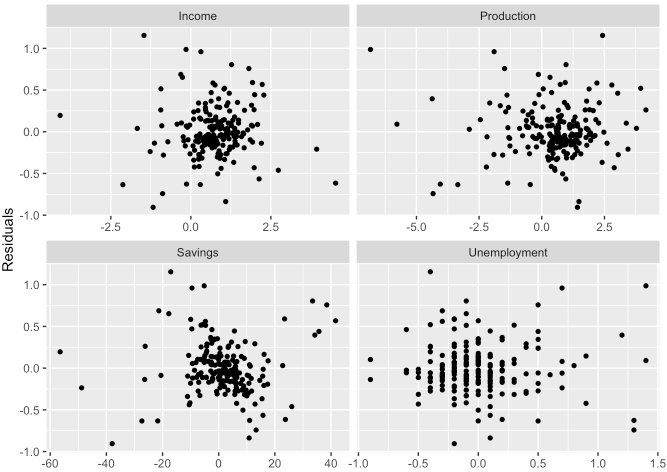
- 위 그래프에서 보이다시피 각 변수별 잔차가 무작위로 흩어져 분포되어 있는 것처럼 보이므로 어느 정도 가정을 만족한다고 볼 수 있습니다.
Residual plots against fitted values
- 적합된 값과 잔차간의 분포에도 특별한 패턴이 보이면 안됩니다.
- 패턴이 관찰되면 오차에 등분산성 가정이 위배될 가능성이 있기 때문입니다.
- 이렇게 등분산성 가정이 만족하지 못할 경우 로그 또는 제곱근과 같이 변수의 변환을 주어야할 수도 있습니다.
fit_consMR %>%
  augment() %>%
  ggplot(aes(x = .fitted, y = .resid)) +
  geom_point(size = 1.2) +
  labs(x = "Fitted", y = "Residuals")
- 어느 특정한 패턴이 보이지 않으므로 등분산성을 만족한다고 볼 수 있습니다.
Outliers and influential observations
- 대부분의 관측값과 비교하여 극단적인 값을 취하는 값을 이상치라고 합니다.
- 회귀 모델의 추정 계수에 큰 영향을 미치는 관측치는 영향력 있는 관측치(influential observations)라고 합니다.
- 일반적으로 영향력 있는 관측치는 극단의 이상치일 가능성도 있습니다.
- 이러한 이상치들을 무조건 제거한다고 그게 올바르다고 보기는 어렵습니다.
이상치여도 의미 있는 값이 있을수도 있기에, 그 값이 가능한 이유에 대해서 분석하는 것이 중요합니다.
Spurious regression
- 시계열 데이터는 종종 정상성(stationarity)을 보이지 않는 경우도 있습니다.
- 시간이 지나도 분산이 일정한.. 즉, 시계열의 변동이 시간의 흐름에 따라 일정한 것을 정상성이라고 이해하시면 됩니다.
- 이렇게 비정상 시계열은 정상 시계열로 변환해줄 필요가 있습니다.
- 비정상 시계열을 회귀 모형에 적합하면 부정확한 모형이 될 가능성이 있기 때문입니다.
temp_fit <- aus_airpassengers %>%
  filter(Year <= 2011) %>%
  left_join(guinea_rice, by = "Year") %>%
  model(TSLM(Passengers ~ Production))

temp_fit %>%
  report()
## Series: Passengers
## Model: TSLM
##
## Residuals:
## Min 1Q Median 3Q Max
## -5.9448 -1.8917 -0.3272 1.8620 10.4210
##
## Coefficients:
## Estimate Std. Error t value Pr(>|t|)
## (Intercept) -7.493 1.203 -6.229 2.25e-07 ***
## Production 40.288 1.337 30.135 < 2e-16 ***
## ---
## Signif. codes: 0 '***' 0.001 '**' 0.01 '*' 0.05 '.' 0.1 ' ' 1
##
## Residual standard error: 3.239 on 40 degrees of freedom
## Multiple R-squared: 0.9578, Adjusted R-squared: 0.9568
## F-statistic: 908.1 on 1 and 40 DF, p-value: < 2.22e-16temp_fit %>%
gg_tsresiduals()
Some useful predictors
Trend
\[y_{t} = \beta_{0} + \beta_{1} t + \epsilon_{t}\]
TSLM()함수에는trend()를 적용하여 추세 변수를 지정할 수 있습니다.
Dummy variables
- 예를 들어 시계열 데이터에서 어떤 특정 날짜가 공휴일인지 여부를 고려할 때 변수에 공휴일이면 1, 아니면 0 과 같이 값을 취할 수 있습니다.
- 이를 더미 변수라고 하며 Indicator variable이라고도 불리웁니다.
- 범주가 세 개 이상인 k개일 경우에는 (k-1)개의 변수를 더미처리하여 사용할 수 있습니다.
TSLM()함수에서는 더미 지정하면 이를 자동으로 처리해줍니다.
Seasonal dummy variables
- 계절성을 갖는 더미 변수(요일, 분기 등)도 마찬가지로
TSLM()함수 내season()을 적용하여 지정할 수 있습니다. - 아래 예시를 들어 확인해보겠습니다. (호주의 분기별 맥주 생산량 데이터)
recent_production <- aus_production %>%
  filter(year(Quarter) >= 1992)

recent_production %>%
  autoplot(Beer) +
  labs(y = "Megalitres", title = "Australian quarterly beer production")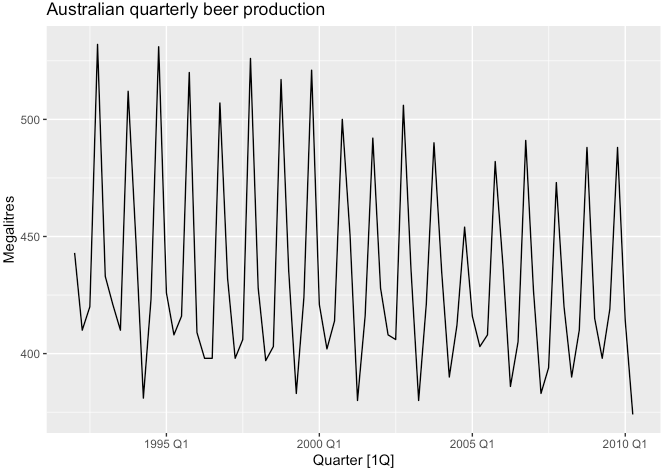
- 미래의 맥주 생산량을 확인해보고 싶습니다.
- 선형 추세(trend)와 더미 변수가 있는 회귀 모형을 사용하여 모델링할 수 있습니다.
- 분기 데이터이기에 더미는 세 개가 됩니다. (4-1 = 3)
\[y_{t} = \beta_{0} + \beta_{1}t + \beta_{2}t_{2, t} + \beta_{3}t_{3, t} + \beta_{4}t_{4, t} + \epsilon_t\]
# trend() 함수와 season() 함수는 디폴트로 들어가는 표준함수가 아닙니다. 필요 시 TSLM() 함수 안에서 적용합니다.
fit_beer <- recent_production %>%
  model(TSLM(formula = Beer ~ trend() + season()))

fit_beer %>%
  report()
## Series: Beer
## Model: TSLM
##
## Residuals:
## Min 1Q Median 3Q Max
## -42.9029 -7.5995 -0.4594 7.9908 21.7895
##
## Coefficients:
## Estimate Std. Error t value Pr(>|t|)
## (Intercept) 441.80044 3.73353 118.333 < 2e-16 ***
## trend() -0.34027 0.06657 -5.111 2.73e-06 ***
## season()year2 -34.65973 3.96832 -8.734 9.10e-13 ***
## season()year3 -17.82164 4.02249 -4.430 3.45e-05 ***
## season()year4 72.79641 4.02305 18.095 < 2e-16 ***
## ---
## Signif. codes: 0 '***' 0.001 '**' 0.01 '*' 0.05 '.' 0.1 ' ' 1
##
## Residual standard error: 12.23 on 69 degrees of freedom
## Multiple R-squared: 0.9243, Adjusted R-squared: 0.9199
## F-statistic: 210.7 on 4 and 69 DF, p-value: < 2.22e-16- 적합된 결과를 확인해보면 분기당 평균 -0.34 감소 추세가 있습니다.
- 평균적으로 2분기는 1분기보다 -34.7, 3분기는 1분기보다 -17.8, 반면 4분기는 1분기보다 72.8 정도 생산량이 많습니다.
fit_beer %>%
  augment() %>%
  ggplot(aes(x = Quarter)) +
  geom_line(aes(y = Beer, colour = "Data")) +
  geom_line(aes(y = .fitted, colour = "Fitted")) +
  scale_colour_manual(values = c(Data = "black", Fitted = "#D55E00")) +
  labs(y = "Megalitres", title = "Australian quarterly beer production") +
  guides(colour = guide_legend(title = "Series"))
- 아래 그래프와 같이 분기별 실제 맥주 생산량과 예상치를 표현해볼 수도 있습니다.
fit_beer %>%
  augment() %>%
  ggplot(aes(x = Beer, y = .fitted, colour = factor(quarter(Quarter)))) +
  geom_point(size = 1.2) +
  labs(x = "Actual values", y = "Fitted", title = "Australian quarterly beer production") +
  geom_abline(intercept = 0, slope = 1) +
  guides(colour = guide_legend(title = "Quarter"))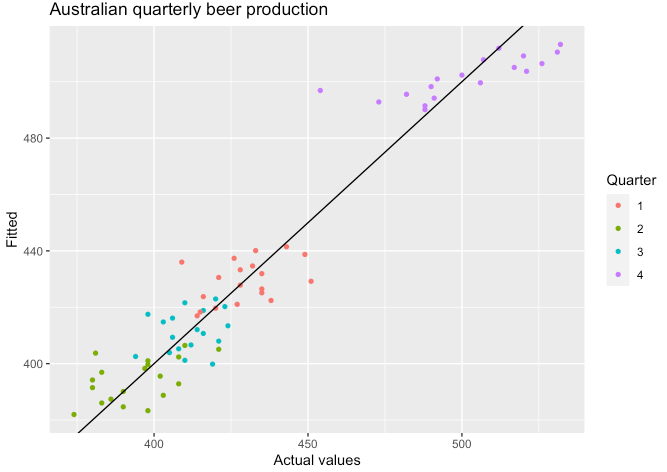
Intervention variables
- 종속 변수에 영향을 줄 수 있는 변수들을 개입하는 것이 종종 필요할 수도 있습니다.
- 예를 들자면 특정 프로모션 기간 전후에 차이가 있다고 가정할 때 프로모션 전에는 0, 후에는 1과 같이 더미처럼 변수 개입을 주는 것입니다.
- 이러한 개입은 piecewise linear trend가 되기에 기울기의 변화가 발생하게 되고, 이는 즉 비선형에 해당되게 됩니다.
Fourier series
- 긴 계절 기간 동안 계절 더미 변수를 사용할 때 대안 중 하나는 푸리에(Fourier) 항을 사용하는 것입니다.
- \(m\) = seasonal period
- \(x_{1, t} = \sin\big(\frac{2\pi t}{m}\big)\)
- \(x_{2, t} = \cos\big(\frac{2\pi t}{m}\big)\)
- \(x_{3, t} = \sin\big(\frac{4\pi t}{m}\big)\)
- \(x_{4, t} = \cos\big(\frac{4\pi t}{m}\big)\)
- \(x_{5, t} = \sin\big(\frac{6\pi t}{m}\big)\)
- \(x_{6, t} = \cos\big(\frac{6\pi t}{m}\big)\)
- …
- 푸리에 항을 사용하면 더미 변수가 줄어들 수 있는 이점을 갖습니다.
- 예를 들자면 시계열이 주간 단위로 되어 있는 케이스 등이 될 것 같습니다. (\(m = 52\))
- 이러한 푸리에 항은
fourier()함수로 적용할 수 있습니다.Karguments는 몇개의 sin, cos 항을 포함시킬지 결정하는 부분- \(m\)이 계절 주기라고 할 때 허용되는 \(K\)의 최대값은 \(K = m/2\)
- 분기별 데이터이므로 \(m=4\)이기에 여기서는 \(K=2\)
recent_production %>%
  model(TSLM(formula = Beer ~ trend() + fourier(K = 2))) %>%
  report()
## Series: Beer
## Model: TSLM
##
## Residuals:
## Min 1Q Median 3Q Max
## -42.9029 -7.5995 -0.4594 7.9908 21.7895
##
## Coefficients:
## Estimate Std. Error t value Pr(>|t|)
## (Intercept) 446.87920 2.87321 155.533 < 2e-16 ***
## trend() -0.34027 0.06657 -5.111 2.73e-06 ***
## fourier(K = 2)C1_4 8.91082 2.01125 4.430 3.45e-05 ***
## fourier(K = 2)S1_4 -53.72807 2.01125 -26.714 < 2e-16 ***
## fourier(K = 2)C2_4 -13.98958 1.42256 -9.834 9.26e-15 ***
## ---
## Signif. codes: 0 '***' 0.001 '**' 0.01 '*' 0.05 '.' 0.1 ' ' 1
##
## Residual standard error: 12.23 on 69 degrees of freedom
## Multiple R-squared: 0.9243, Adjusted R-squared: 0.9199
## F-statistic: 210.7 on 4 and 69 DF, p-value: < 2.22e-16Selecting predictors
- 회귀 모형 적합 이후 변수를 선별할 때 우리는 흔히 p-value 값이 일정 유의수준 이하인 경우를 채택했습니다.
- 하지만 이렇게 p-value의 통계적 유의성이 항상 맞고 옳다고는 보기 어렵습니다.
- 두 개 이상의 변수가 서로 상관 관계가 있을 경우에 p-value로의 판단은 잘못된 판단이 될 수도 있기 때문입니다.
- 이러한 오차를 최소화하기 위해 변수 클렌징이 다 된 최종 모형에 대한 평가를 고려해볼 수 있습니다.
glance()함수는 이러한 값을 제공해줍니다.
fit_consMR %>%
  glance() %>%
  select(adj_r_squared, CV, AIC, AICc, BIC)
## # A tibble: 1 x 5
## adj_r_squared CV AIC AICc BIC
## <dbl> <dbl> <dbl> <dbl> <dbl>
## 1 0.763 0.104 -457. -456. -437.
Adjusted R-squared
- 일반적인 \(R^2\) 값은 모형이 과거 데이터에 얼마나 잘 맞는지를 측정하지만, 미래에 예측을 얼마나 잘하는지는 측정하지 않습니다.
- 또한 자유도(degree of freedom) 항을 고려하지 않기에 변수가 많을수록 \(R^2\) 값은 증가하는 경향이 있습니다.
- 따라서 이렇게 자유도 항을 고려한 것이 Adjusted R-squared 입니다.
- 우리말로는 조정된 결정계수 또는 수정된 결정계수 라고도 부르는 것 같습니다.
- 이 값을 최대화하는 것은 모델 오차항의 표준오차 \(\sigma_{e}\)를 최소화하는 것과 같습니다.
Cross-validation
- 설명이 길어지기에 일단 교차검증에 대한 위키 백과 링크를 첨부드립니다.
- 시계열에서도 마찬가지로 교차 검증은 모델의 예측력을 평가하기 위한 일반적인 방법입니다.
- 이 값이 작을수록 좋은 모형이라고 평가할 수 있습니다.
Akaike’s Information Criterion
\[\text{AIC} = T \log\bigg(\frac{\text{SSE}}{T}\bigg) + 2(k+2)\]
- \(T\)는 관측치의 수, \(k\)는 변수의 수 입니다.
- 마찬가지로 작은 값을 가질수록 가장 적합한 모형이라고 평가할 수 있습니다.
- AIC를 최소화하는 것은 CV를 최소화하는 것과 동일한 맥락이라고 볼 수 있습니다.
Corrected Akaike’s Information Criterion
- 관측치의 수 \(T\)가 작을 때 AIC는 너무 많은 예측 변수를 선택하는 경향이 있으므로 아래와 같이 수정된 버전입니다.
\[\text{AIC}_{c} = \text{AIC} + \frac{2(k+2)(k+3)}{T-k-3}\]
- 마찬가지로 작을수록 베스트입니다.
Schwarz’s Bayesian Information Criterion
\[\text{BIC} = T\log\bigg(\frac{\text{SSE}}{T}\bigg) + (k+2)\log(T)\]
- AIC와 동일한 맥락으로 BIC를 최소화하는 것이 좋습니다.
Which measure should we use?
- 관련 문서에서는 AICc, AIC 또는 CV 통계량 중 하나를 사용하는 것을 추천합니다.
- 길지 않으니 관련 문서를 꼭 한 번 읽어보시길 권장드립니다.
- 대부분의 예시들에서도 AICc 값으로 예측 모형을 선택하겠습니다.
Forecasting with regression
TSLM()함수에 적합된 객체를 가지고forecast()함수를 적용하여 예측을 해볼 수 있습니다.
fit_beer %>%
  report()
## Series: Beer
## Model: TSLM
##
## Residuals:
## Min 1Q Median 3Q Max
## -42.9029 -7.5995 -0.4594 7.9908 21.7895
##
## Coefficients:
## Estimate Std. Error t value Pr(>|t|)
## (Intercept) 441.80044 3.73353 118.333 < 2e-16 ***
## trend() -0.34027 0.06657 -5.111 2.73e-06 ***
## season()year2 -34.65973 3.96832 -8.734 9.10e-13 ***
## season()year3 -17.82164 4.02249 -4.430 3.45e-05 ***
## season()year4 72.79641 4.02305 18.095 < 2e-16 ***
## ---
## Signif. codes: 0 '***' 0.001 '**' 0.01 '*' 0.05 '.' 0.1 ' ' 1
##
## Residual standard error: 12.23 on 69 degrees of freedom
## Multiple R-squared: 0.9243, Adjusted R-squared: 0.9199
## F-statistic: 210.7 on 4 and 69 DF, p-value: < 2.22e-16fc_beer <- fit_beer %>%
forecast()
fc_beer## # A fable: 8 x 4 [1Q]
## # Key: .model [1]
## .model Quarter Beer .mean
## <chr> <qtr> <dist> <dbl>
## 1 TSLM(formula = Beer ~ trend() + season()) 2010 Q3 N(398, 164) 398.
## 2 TSLM(formula = Beer ~ trend() + season()) 2010 Q4 N(489, 164) 489.
## 3 TSLM(formula = Beer ~ trend() + season()) 2011 Q1 N(416, 165) 416.
## 4 TSLM(formula = Beer ~ trend() + season()) 2011 Q2 N(381, 165) 381.
## 5 TSLM(formula = Beer ~ trend() + season()) 2011 Q3 N(397, 166) 397.
## 6 TSLM(formula = Beer ~ trend() + season()) 2011 Q4 N(487, 166) 487.
## 7 TSLM(formula = Beer ~ trend() + season()) 2012 Q1 N(414, 166) 414.
## 8 TSLM(formula = Beer ~ trend() + season()) 2012 Q2 N(379, 166) 379.- 그 결과를 시각화로 표현한 결과는 아래와 같습니다.
- 음영으로 된 구간중 어두운 음영은 예측 80% 신뢰구간, 조금 더 밝은 음영은 95% 신뢰구간을 나타냅니다.
fc_beer %>%
  autoplot(recent_production) +
  labs(y = "megalitres", title = "Forecasts of beer production using regression")
- 이번엔 다른 데이터인
us_change로 시나리오 기반 예측을 해보겠습니다.
us_change## # A tsibble: 198 x 6 [1Q]
## Quarter Consumption Income Production Savings Unemployment
## <qtr> <dbl> <dbl> <dbl> <dbl> <dbl>
## 1 1970 Q1 0.619 1.04 -2.45 5.30 0.9
## 2 1970 Q2 0.452 1.23 -0.551 7.79 0.5
## 3 1970 Q3 0.873 1.59 -0.359 7.40 0.5
## 4 1970 Q4 -0.272 -0.240 -2.19 1.17 0.700
## 5 1971 Q1 1.90 1.98 1.91 3.54 -0.100
## 6 1971 Q2 0.915 1.45 0.902 5.87 -0.100
## 7 1971 Q3 0.794 0.521 0.308 -0.406 0.100
## 8 1971 Q4 1.65 1.16 2.29 -1.49 0
## 9 1972 Q1 1.31 0.457 4.15 -4.29 -0.200
## 10 1972 Q2 1.89 1.03 1.89 -4.69 -0.100
## # … with 188 more rows- 여기서 시나리오는 아래와 같이 셋팅합니다.
- 고용률(Unemployment 관련)의 변화 없이 소득(Income)과 저축(Savings)이 각각 1%와 0.5%로 증가하거나 감소
- 예측을 위한 시나리오 셋팅은
scenarios()함수를 통해 구성해볼 수 있습니다.
tsibble라이브러리 내new_data()함수는 key-index 조합으로 원하는 시점만큼의 미래 값을 생성해주는 함수입니다.
# 회귀모형 적합
fit_consBest <- us_change %>%
  model(lm = TSLM(formula = Consumption ~ Income + Savings + Unemployment))

# 시나리오 구성
future_scenarios <- scenarios(
  Increase = new_data(us_change, 4) %>%
    mutate(
      Income = 1,
      Savings = 0.5,
      Unemployment = 0
    ),
  Decrease = new_data(us_change, 4) %>%
    mutate(
      Income = -1,
      Savings = -0.5,
      Unemployment = 0
    ),
  names_to = "Scenario"
)

future_scenarios
## $Increase
## # A tsibble: 4 x 4 [1Q]
## Quarter Income Savings Unemployment
## <qtr> <dbl> <dbl> <dbl>
## 1 2019 Q3 1 0.5 0
## 2 2019 Q4 1 0.5 0
## 3 2020 Q1 1 0.5 0
## 4 2020 Q2 1 0.5 0
##
## $Decrease
## # A tsibble: 4 x 4 [1Q]
## Quarter Income Savings Unemployment
## <qtr> <dbl> <dbl> <dbl>
## 1 2019 Q3 -1 -0.5 0
## 2 2019 Q4 -1 -0.5 0
## 3 2020 Q1 -1 -0.5 0
## 4 2020 Q2 -1 -0.5 0
##
## attr(,"names_to")
## [1] "Scenario"- 이러한 시나리오 구성을
forecast()함수 내new_dataargument에 적용합니다.
fc <- fit_consBest %>%
  forecast(new_data = future_scenarios)

fc
## # A fable: 8 x 8 [1Q]
## # Key: Scenario, .model [2]
## Scenario .model Quarter Consumption .mean Income Savings Unemployment
## <chr> <chr> <qtr> <dist> <dbl> <dbl> <dbl> <dbl>
## 1 Increase lm 2019 Q3 N(1, 0.098) 0.996 1 0.5 0
## 2 Increase lm 2019 Q4 N(1, 0.098) 0.996 1 0.5 0
## 3 Increase lm 2020 Q1 N(1, 0.098) 0.996 1 0.5 0
## 4 Increase lm 2020 Q2 N(1, 0.098) 0.996 1 0.5 0
## 5 Decrease lm 2019 Q3 N(-0.46, 0.1) -0.464 -1 -0.5 0
## 6 Decrease lm 2019 Q4 N(-0.46, 0.1) -0.464 -1 -0.5 0
## 7 Decrease lm 2020 Q1 N(-0.46, 0.1) -0.464 -1 -0.5 0
## 8 Decrease lm 2020 Q2 N(-0.46, 0.1) -0.464 -1 -0.5 0- 이를 가지고
autolayer()함수에 시나리오 예측 적용 객체를 씌워주어 아래와 같이 시각화 해볼 수 있습니다.
us_change %>%
  autoplot(Consumption) +
  autolayer(fc) +
  labs(title = "US consumption", y = "% change")
Nonlinear regression
- 일반적인 모형의 수식 형태는 아래와 같습니다.
\[y_{t} = f(x_{t})+\epsilon_{t}\]
- 여기서 함수 \(f()\)는 비선형함수를 고려합니다.
- 가장 단순한 형태의 \(f()\) 함수는 piecewise linear 포맷이 있을 수 있습니다.
- regression splines 스플라인 회귀도 있습니다.
- 2차항 이상의 고차항 함수를 적용하거나 자연로그 (변수 값들이 양수 이상 일때) 등을 씌우는 방법도 있습니다.
- 아래 예시를 들어 보겠습니다.
boston_men <- boston_marathon %>%
  filter(Year >= 1924 & Event == "Men's open division") %>%
  mutate(Minutes = as.numeric(Time)/60)

boston_men
## # A tsibble: 96 x 6 [1Y]
## # Key: Event [1]
## Event Year Champion Country Time Minutes
## <fct> <int> <chr> <chr> <drtn> <dbl>
## 1 Men's open divis… 1924 Clarence H. DeMar United Stat… 8980 se… 150.
## 2 Men's open divis… 1925 Charles L. (Chuck) Me… United Stat… 9180 se… 153
## 3 Men's open divis… 1926 John C. Miles Canada 8740 se… 146.
## 4 Men's open divis… 1927 Clarence H. DeMar United Stat… 9622 se… 160.
## 5 Men's open divis… 1928 Clarence H. DeMar United Stat… 9427 se… 157.
## 6 Men's open divis… 1929 John C. Miles Canada 9188 se… 153.
## 7 Men's open divis… 1930 Clarence H. DeMar United Stat… 9288 se… 155.
## 8 Men's open divis… 1931 James P. Henigan United Stat… 10005 se… 167.
## 9 Men's open divis… 1932 Paul de Bruyn Germany 9216 se… 154.
## 10 Men's open divis… 1933 Leslie S. Pawson United Stat… 9061 se… 151.
## # … with 86 more rowsboston_men %>%
autoplot(Minutes) +
geom_smooth(formula = y ~ x, se = FALSE, method = "lm") +
labs(x = "Year", y = "Minutes")
boston_men %>%
  model(TSLM(formula = Minutes ~ trend())) %>%
  gg_tsresiduals()
- 위 그래프에서 시간이 지남에 따라 감소하는 듯한 선형 추이를 보이지만,
선형추세로 나온 잔차를 보면 비선형 패턴이 보여지게 됩니다. - 따라서 아래 코드와 같이 자연로그 또는 piecewise reg. 등을 적합시켜 비교해보겠습니다.
fit_trends <- boston_men %>%
  model(
    linear = TSLM(formula = Minutes ~ trend()),
    exponential = TSLM(formula = log(Minutes) ~ trend()),
    piecewise = TSLM(formula = Minutes ~ trend(knots = c(1950, 1980)))
  )

fc_trends <- fit_trends %>%
  forecast(h = 10)

boston_men %>%
  autoplot(Minutes) +
  geom_line(data = fit_trends %>% fitted(), aes(y = .fitted, colour = .model)) +
  autolayer(fc_trends, alpha = 0.5, level = 95) +
  labs(y = "Minutes", title = "Boston marathon winning times")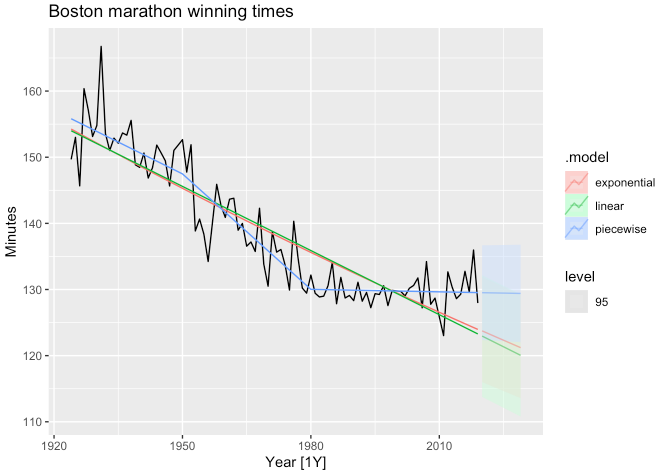
- 가장 베스트는 piecewise reg.에서 도출될 것 같습니다.
'time-series (tidy approach)' 카테고리의 다른 글
| [R] 7. ARIMA (AutoRegressive Integrated Moving Average) (0) | 2021.08.06 |
|---|---|
| [R] 6. Exponential smoothing (0) | 2021.07.29 |
| [R] 4. feasts (0) | 2021.07.28 |
| [R] 3. tsibbledata (0) | 2021.07.28 |
| [R] 2. tsibble (0) | 2021.07.27 |

